nsqadmin
nsqadmin is a Web UI to view aggregated cluster stats in realtime and perform various
administrative tasks.
Command Line Options
-acl-http-header string
    HTTP header to check for authenticated admin users (default "X-Forwarded-User")
-admin-user value
    admin user (may be given multiple times; if specified, only these users will be able to perform privileged actions; acl-http-header is used to determine the authenticated user)
-allow-config-from-cidr string
    A CIDR from which to allow HTTP requests to the /config endpoint (default "127.0.0.1/8")
-base-path string
    URL base path (default "/")
-config string
    path to config file
-graphite-url string
    graphite HTTP address
-http-address string
    <addr>:<port> to listen on for HTTP clients (default "0.0.0.0:4171")
-http-client-connect-timeout duration
    timeout for HTTP connect (default 2s)
-http-client-request-timeout duration
    timeout for HTTP request (default 5s)
-http-client-tls-cert string
    path to certificate file for the HTTP client
-http-client-tls-insecure-skip-verify
    configure the HTTP client to skip verification of TLS certificates
-http-client-tls-key string
    path to key file for the HTTP client
-http-client-tls-root-ca-file string
    path to CA file for the HTTP client
-log-level value
    set log verbosity: debug, info, warn, error, or fatal (default INFO)
-log-prefix string
    log message prefix (default "[nsqadmin] ")
-lookupd-http-address value
    lookupd HTTP address (may be given multiple times)
-notification-http-endpoint string
    HTTP endpoint (fully qualified) to which POST notifications of admin actions will be sent
-nsqd-http-address value
    nsqd HTTP address (may be given multiple times)
-proxy-graphite
    proxy HTTP requests to graphite
-statsd-counter-format string
    The counter stats key formatting applied by the implementation of statsd. If no formatting is desired, set this to an empty string. (default "stats.counters.%s.count")
-statsd-gauge-format string
    The gauge stats key formatting applied by the implementation of statsd. If no formatting is desired, set this to an empty string. (default "stats.gauges.%s")
-statsd-interval duration
    time interval nsqd is configured to push to statsd (must match nsqd) (default 1m0s)
-statsd-prefix string
    prefix used for keys sent to statsd (%s for host replacement, must match nsqd) (default "nsq.%s")
-verbose
    [deprecated] has no effect, use --log-level
-version
    print version string
statsd / Graphite Integration
When using nsqd --statsd-address=... you can specify a nsqadmin
--graphite-url=https://graphite.yourdomain.com to enable graphite charts in nsqadmin. If using a
statsd clone (like statsdaemon) that does not prefix keys, also specify
--use-statsd-prefix=false.
Admin Notifications
If the --notification-http-endpoint flag is set, nsqadmin will send a POST request to the
specified (fully qualified) endpoint each time an admin action (such as pausing a channel) is
performed.
The body of the request contains information about the action (some fields will be omitted when appropriate), like so:
{
  "action": "unpause_channel",
  "channel": "mouth",
  "topic": "beer",
  "timestamp": 1357683731,
  "user": "df",
  "user_agent": "Mozilla/5.0 (Macintosh; Iphone 8)",
  "remote_ip": "1.2.3.4:5678",
  "url": "http://nsqadmin.local/api/topics/api_requests/nsq_to_file",
  "via": "localhost"
}
The user field will be filled if a HTTP Basic Authentication Username is present in the request made to nsqadmin,
say if it were running with htpasswd authentication or behind oauth2_proxy.
Hint: You can create an NSQ stream of admin action notifications with the topic name admin_actions
by setting --notification-http-endpoint to point to the nsqd HTTP Publish API. For example if running nsqd on the same node you could use --notification-http-endpoint="http://127.0.0.1:4151/put?topic=admin_actions"
There are community contributed utilities nsqadmin2slack and nsqadmin2hipchat to relay messages to HipChat and Slack respectively.
Actions that are captured are:
create_channelcreate_topicdelete_channeldelete_topicempty_channelempty_topicpause_channelpause_topictombstone_topic_producerunpause_channelunpause_topic
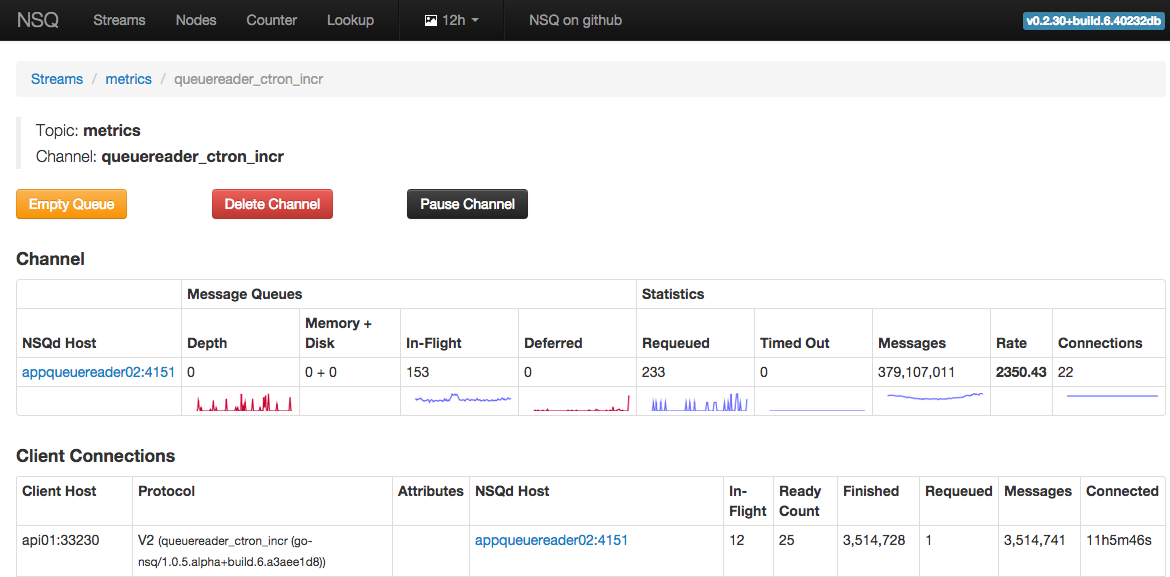
Metrics
The following metrics are exposed through nsqadmin on Topic, Channel and Client Connections.
Message Queues:
Depth: Current sum of messages in memory + on disk (i.e. the “backlog” of messages pending delivery).In-Flight: Current count of messages delivered but not yet finished (FIN), requeued (REQ) or timed out.Deferred: Current count of messages that were requeued and explicitly deferred which are not yet available for delivery.
Statistics:
Requeued: Total times a message has been added back to the queue due to time outs or explicit requeues.Timed Out: Total times a message has been requeued after not receiving a response from the client before the configured timeout.Messages: Total count of new messages recieved since node startup.Rate: The per-second rate of new messages over the previous two statsd intervals (available only when graphite integration is enabled).Connections: Current number of connected clients.Delivery: Messages delivered to consumers in each topology category (zoneLocal, regionLocal, global) over the lifetime of the host by percentage (available only when topology-aware-consumption experiment is enabled in nsqd and messages > 0)
Client Connections:
Client Host: Client ID (hostname) and on-hover the connection remote-address.Protocol: NSQ protocol version and client user-agent.Attributes: TLS and AUTH connection state, topology category with respect to the nsqd host (zoneLocal, regionLocal, global).NSQd Host: Address of the nsqd node this client is connected to.In-flight: Current count of messages awaiting response that have been delivered to this client.Ready Count: Max number of messages that can be in-flight on this connection. This is controlled by a client’smax_in_flightsetting.Finished: Total count of messages that this client has finished (FIN).Requeued: Total count of messages that this client has requeued (REQ).Messages: Total count of messages delivered to this client.
If the topology aware consumption experiment is enabled for the nsqd host, client connections in the same zone as the nsqd host will be displayed in green. Client connections in the same region but a different zone as the nsqd host will be displayed in yellow.